Peer-to-Peer allows you to customize your charts and graphs to your liking.
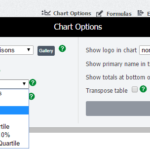
1. To edit any chart, click ‘Chart Options’ located on the top right of every graph. You can also click to edit chart options by hovering over the title of any built-in display on the left side of the program and by clicking ‘Options’.
2. On this pop up, you can create your own color scheme to reflect your company’s colors, change the display frequency, show data labels, and more!
Chart Customization Options

3. Choose among the following options, depending on your analysis and audience:
- 3D effects– Add 3D effects to the graph
- Display Type– Change the type of chart (i.e change from bar to line).
- Display frequency– Change the display frequency to be quarterly, semi-annually, or annually.
- Bar shape– Choose the type of bar graph you would like (prism, cylinder, or cone).
- Number of quarters to show– Choose the number of quarters you would like to show on the chart.
- Show current cycle in title– Select this box if you want the current cycle to show in the display title.
- Show data labels– Choose to show data labels (either black or colored) on the graph.
- Show primary name in title– Select this box if you want the name of the primary to show in the display title.
- Start axis at zero– Check this box if you want to start the y-axis at 0.
- Show logo in chart– You can upload a company logo under Settings-‘Upload Company Logo’. To add it to your chart, choose the Customer option from the drop down.
- Show trend line– Check this box if you want to include a trend line in the chart.
- Chart interaction– Add an annotation box or tracking markers
- Legend Position– Choose where you would like the legend to be positioned (ie. top, bottom, right, etc.).
- Allow X axis to float– Choose this option if you want your axis to be able to adjust top to the data.
4. Click ‘Save’ to save any of your customizations.
5. Once you click save, you will be asked if you want to:
- Save these options temporarily for this display (for this session only)
- Save them permanently for this display (For example, if you are looking at the Total Assets chart, and you choose this option, every time you pull this built-in display it will reflect these changes).
- Save them permanently as defaults for all displays of this type. (For example, if you are looking at the Total Assets chart, and you choose this option, every time you pull a bar graph like this chart, it will reflect these changes).
- Don’t save these settings.


