Peer-To-Peer Sharing Your Analysis

P2P: How To Use The Slideshow Feature

Peer-to-Peer Cloud Edition lets you start a slide show without having to export any graphs or charts to PowerPoint. Use this feature to quickly show graphs and charts during your staff meetings or other presentations, no downloading necessary!

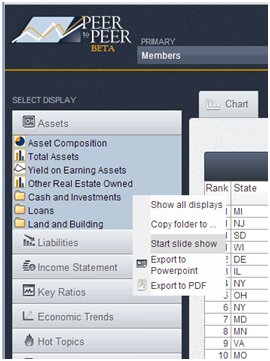
To start a slide show, hover over any folder or individual chart or graph in the left-hand side of the program. Click ‘Start slide show’.

slideshow-1

Once the slide show starts, use your right and left arrows on your computer keyboard or click the arrows on the screen to move the presentation forward or backward.

To close out the slide show at any time, click the ‘X’ in the bottom middle portion of the screen.

slideshow-2

Related Content

  • P2P: How To Identify 5300 Call Report Data

    All fields and account codes located on the 5300 call report can be accessed in Peer-to-Peer. Read more to learn how to identify which account codes are being used in...
  • P2P: Get a Jump Start on Analysis with Early Data

    You don’t have to wait for official data to be released to start your quarterly analysis, Callahan makes it easy to get a head start! As the quarter ends, Callahan...
  • P2P: How To Create A Custom Peer Group

    Peer-to-Peer’s allows you to customize your peer group selections. Tailor your comparison sets to make your analysis more meaningful by comparing one credit union to other credit unions or banks...
  • P2P Tutorial: How To Use The Search Bar (207)

    Peer-to-Peer has a universal search bar which allows you to look for graphs, formulas, account codes, and institutions within the software. This shortcut will allow you to use the software...