Watch the video below to learn about the difference between “Start Cycle” and “Cycle” in Peer-to-Peer. The video will also discuss how the length of a trend line can dramatically alter the way data is interpreted.
Related Content
P2P: How To Use The Formula Wizard
What is the Formula Wizard? In addition to the pre-built displays and peer groups in Peer-to-Peer, the software allows you to build custom peer groups and custom displays to best...
P2P: How To Create Tabs
Peer-to-Peer now includes tabs so you can open new charts and refer back to old ones all in one session. This feature works very similar to how tabs work in...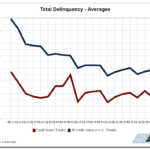
P2P: Weighted Averages
When working with ratios in Peer-to-Peer, averages will not be a simple summation of the ratio divided by the total number of institutions. Instead, Peer-to-Peer uses a weighted average.Peer Pro Tip | Vol. I – Scoring: Your Credit Union Performance Profile
Scoring: Your Credit Union Performance Profile The Credit Union Performance Profile was developed by Callahan & Associates to quantify key areas of asset quality, capital adequacy, earnings and operating efficiency,...