Peer-To-Peer Using & Modifying Displays

P2P: List Of Built-In Displays

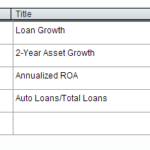
Peer-to-Peer comes with hundreds of unique built-in displays. Download this attached list of all included built-in displays to locate graphs or charts you may be interested in using for your performance analysis.

Currently, Peer-to-Peer is organized into the following nine categories:

  • Assets
  • Liabilities
  • Income Statement
  • Key Ratios
  • Economic Trends
  • Hot Topics
  • Performance Reports
  • Scoring System
  • Bank Comparison

Download the full list of displays here:

[zilla_button url=”/support/wp-content/uploads/2016/06/Complete-List-of-Peer-Displays.pdf” style=”blue” size=”medium” type=”square” target=”_blank”] Complete List of Peer Displays (PDF) [/zilla_button]

Related Content

  • P2P: Tablets And Mobile Devices

    Peer-to-Peer can be accessed on your tablet, though it is not currently fully functional on all mobile devices. For optimal use of the program we do encourage you to use...
  • P2P: How To Use Formula Modifiers

    Peer-to-Peer includes pre-programmed formulas and also gives you the ability to create your own. To help you in creating these formulas, here are some helpful factors to keep in mind.
  • P2P Tutorial: How To Manage Peer Groups (206)

    Peer-to-Peer allows you to manage your custom built peer groups by editing, deleting, or combining them. Watch this series on how to manage peer groups to learn more!
  • P2P: Econometric Data

    Peer-to-Peer contains macroeconomic data from a variety of different sources, including the U.S. Census Bureau, Bureau of Labor Statistics, Bureau of Economic Analysis, and the Federal Reserve. Additional data about...