Peer-To-Peer Sharing Your Analysis

P2P: How To Use The Slideshow Feature

Peer-to-Peer Cloud Edition lets you start a slide show without having to export any graphs or charts to PowerPoint. Use this feature to quickly show graphs and charts during your staff meetings or other presentations, no downloading necessary!

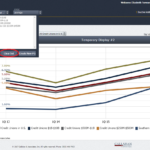
To start a slide show, hover over any folder or individual chart or graph in the left-hand side of the program. Click ‘Start slide show’.

slideshow-1

Once the slide show starts, use your right and left arrows on your computer keyboard or click the arrows on the screen to move the presentation forward or backward.

To close out the slide show at any time, click the ‘X’ in the bottom middle portion of the screen.

slideshow-2

Related Content

  • P2P: How To Use The Formula Wizard

    What is the Formula Wizard? In addition to the pre-built displays and peer groups in Peer-to-Peer, the software allows you to build custom peer groups and custom displays to best...
  • Historical ROM Values

    The ROM percentile score is a great indicator for how well a credit union serves its members compared to its peers. Some credit unions use this score to track their...
  • P2P Tutorial: How To Create A Custom Peer Group By Criteria (203)

    Creating a custom peer group can help make your analysis more meaningful by refining your search across various metrics and operational characteristics. Watch this eight part series to learn how...
  • P2P: How To Share Displays

    Peer-to-Peer makes it easy to share custom displays and folders with other users at your organization. Read this how-to document to learn more.