Peer-To-Peer Support

Peer-To-Peer Using & Modifying Displays

P2P: How To Create Whisker Box Chart

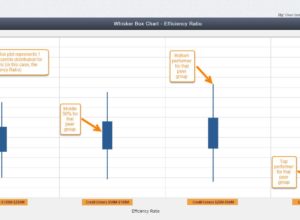
A Whisker Box Chart is a graphical display that shows the percentile distribution of two or more peer groups. This display shows top performers, bottom performers, and where the middle 50th percentile of credit unions in the peer group fall. Now you can quickly view a peer group’s performance distribution to see the highest and lowest performers, as well as everything in between.

Data FAQ Peer-To-Peer

P2P: Econometric Data

Peer-to-Peer contains macroeconomic data from a variety of different sources, including the U.S. Census Bureau, Bureau of Labor Statistics, Bureau of Economic Analysis, and the Federal Reserve. Additional data about U.S. stock markets, the money supply, LIBOR, Fed Funds rate, Treasury rates, and mortgage rates are also included within the program.

Data FAQ Peer-To-Peer

P2P: How To Analyze Vendor Relationships

Looking to go through a core processor conversation? Want to see who your peers use as their credit card processor? We track several vendor relationships here at Callahan & Associates and load this data into Peer-to-Peer.