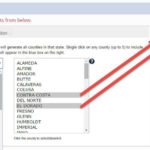
- Your Market Report can be composed of 1 of 3 market types: County, City, or Zip Code. Depending on which market type you choose, the map that generates will differ.
Zip Code Market:

City Market:
If you build a market using cities, a map will not be part of the Market Report. Why? Due to how the data is reported, we are not able to render a map.
County Market:

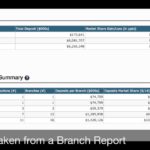
- The “Defined Market Data Summary” table provides insight into the competitive landscape of the market, showing number of institutions, branches, deposits, and the top 3 institutions by deposit market share. The table is broken down by institution type.

- The “Deposit Market Share Leaders by Institution” table is a list of all the institutions in the defined market. The rank defaults to deposit market share.
- To resort the table, hover over any column header and click on the arrow that appears. You may sort ascending or descending.
- Type values in any of the search bars to filter the table. Just want to look at CUs? Type “CU” in the appropriate search bar column.

- Map it! If there are branches from specific institutions you wish to map, check those boxes to the left of “Rank”. Then click the “Map Selected Institutions” button, which will open a new tab with branch pins for those locations you checked

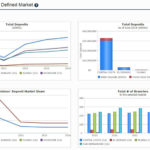
- The 4 “Deposit Trends in Defined Market” graphs are intended to provide insights into market trends as you determine how credit union branches versus bank branches are performing, markets you may want to enter or retreat from, etc.

WANT TO CONDUCT A SIDE-BY-SIDE MARKET COMPARISON?
Scroll to the top of the report and click on the “Compare These Markets” button near the upper right hand corner of the screen. Then check out the “Analyze a Market – Understanding Your Market Comparison Report” document in the training section!

WANT TO PRINT THE ENTIRE MARKET REPORT?
- Right click anywhere on the screen
- Click “Print”


