An Alpha Listing Detailed display gives you the ability to analyze a number of metrics for a list of institutions in a table format.
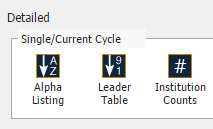
The display will generate a row for each credit union in your ‘Primary’ and ‘Comparison Set’. Once you’ve selected a point of analysis, click ‘Create New Display’. Located in the bottom left corner of the Display Gallery, select Alpha Listing under the Detailed row.

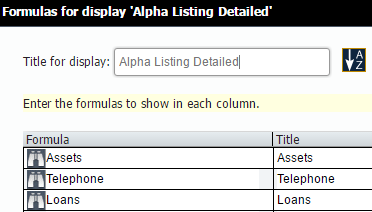
Begin entering the metrics that you would like to analyze for each institution in the formula row. The metrics you enter in the formula rows will display as a column in your table. You can enter a defined fact (ex. Assets, Telephone, Loans), specific account code, or utilize the formula wizard (binoculars) to search and select additional metrics. Ensure there is an associated title populated for each metric. Title your display and click ‘Save’.

Now, you’ve created an Alpha Listing Detailed display analyzing associated metrics for each individual institution in your list. The resulting display is easily exportable to Excel via the ‘Export’ button.


