Watch the video below to learn about the difference between “Start Cycle” and “Cycle” in Peer-to-Peer. The video will also discuss how the length of a trend line can dramatically alter the way data is interpreted.
Related Content
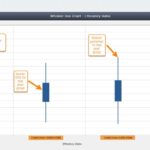
P2P: How To Create Whisker Box Chart
A Whisker Box Chart is a graphical display that shows the percentile distribution of two or more peer groups. This display shows top performers, bottom performers, and where the middle...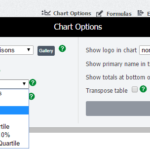
P2P: How to Change Peer Group Values
In addition to viewing your peer group as either a summation or a weighted average, we have added the ability for peer group data to be presented with other types...Account Code Lookup Resources
Looking for a specific account code, or trying to figure out what an account code stands for? Wonder no longer! There are two ways to find out about a given...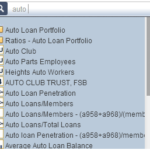
P2P: How To Use Universal Search
Peer-to-Peer includes an advanced search function (located in the top right corner) that allows you to look for individual graphs, formulas, or account codes in the program. From the search...